

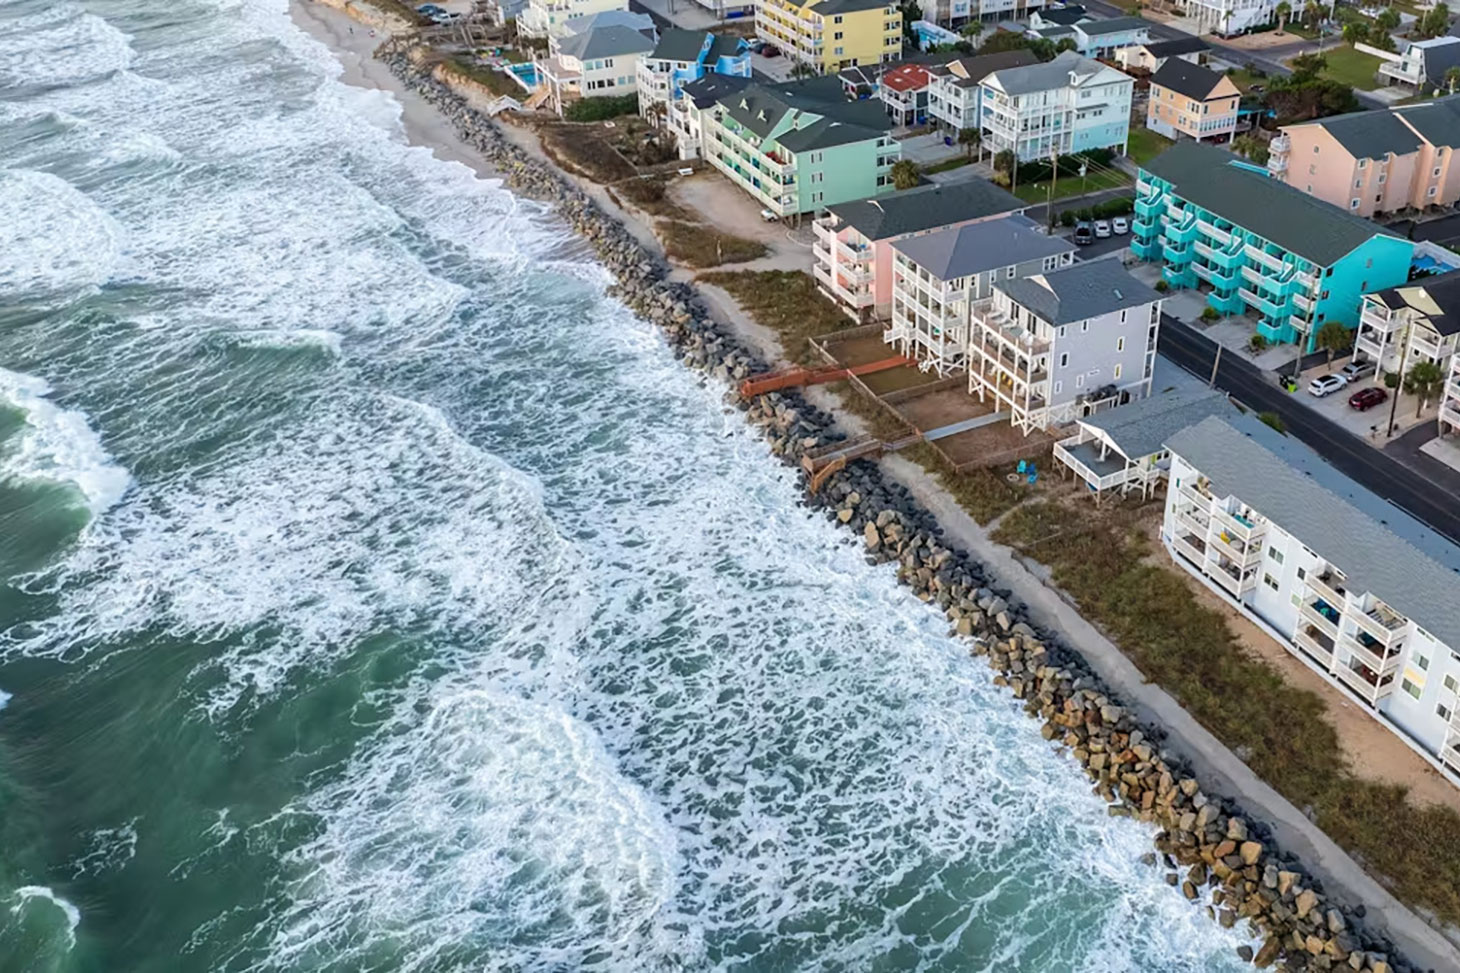
The ocean is one of the environments most affected by climate change.Rising sea levels, in particular, are posing ever-greater challenges to coastal communities. For example, the salinization of soil, subsoil, and groundwater, as well as increased risks of coastal flooding.
In France, many elected officials, administrators, businesses, and coastal residents are wondering about the extent of the phenomenon: by how many centimeters will sea levels rise?
However, this rise depends on many factors. Scientists are wondering how to explain such a complex phenomenon, one that is fraught with uncertainty. How can data from climate models be translated into tools that are understandable, useful, and engaging for the general public, policymakers, and educators?
This is the challenge that many researchers and communicators are taking on by developing “data translation” tools: making science accessible without distorting it.
The European PROTECT project, in which we participated, focuses on the continental cryosphere (all the ice on the continents) and sea-level rise.
The Interactive Website Sea Level Projection Tool, developed as part of this initiative, perfectly illustrates this concept. Created by a multidisciplinary team of scientists, computer scientists, communications specialists, designers, and illustrators, and written in English to reach a broad European and international audience, it is based on three complementary approaches: education, interactivity, and concrete storytelling.
Explain the rise in sea level in an educational way
Sea level is changing due to a number of factors. Some are environmental and directly linked to climate change: the melting of glaciers and ice sheets (those vast masses of ice that cover entire regions, such as Greenland or Antarctica), as well as the thermal expansion of the oceans caused by rising temperatures, are leading to an increase in the volume of water.
Other factors are geological in nature, such as localized subsidence or uplift of land. Finally, climate-related causes depend directly on political decisions: depending on whether we move toward a low-emission transition or a future that prioritizes economic growth, future sea-level trajectories will vary considerably.
The Sea Level Projection Tool website explains these various phenomena in an illustrated glossary. The glossary is based on definitions from the Intergovernmental Panel on Climate Change (IPCC), but it also provides other formats that are easier for the general public to understand.
Clémence Foucher, an illustrator specializing in science, has created visuals that help explain phenomena related to sea-level rise. For example, thermal expansion (that is, the fact that rising temperatures cause water to expand) and the melting of glaciers and ice caps.

These illustrations are part of an illustrated course that explores the main factors contributing to sea-level changes, as well as the associated physical processes—melting, calving (the separation of a mass of ice to form icebergs), etc.
Whenever possible, an explanatory video is also provided to explore the topic in more depth in less than five minutes.
Enhance the fun and interactive aspects
To better understand the causes and impacts of sea-level rise, the website offers an interactive tool that allows anyone to simulate the effects of various factors, such as glacial melt and thermal expansion of the oceans. Each of these phenomena affects sea level differently depending on the region of the globe.
For example, the melting of the Greenland ice sheet causes such a significant redistribution of mass that it alters Earth’s gravity, leading to a more pronounced rise in sea levels in regions far from the source of the melting.
Similarly, some areas, such as northern Europe, are still rising today as a result of the melting of ice in Europe at the end of the last ice age, while others, such as certain coasts in the United States and Asia, are sinking.
By experimenting with these different settings, users can explore how their effects interact and why certain areas are more affected than others. It’s a fun and educational way to come to terms with a complex reality that has very real consequences.
Stories to Illustrate the Impact of Rising Sea Levels
Understanding sea-level rise is an important first step. But this understanding often remains disconnected from people’s everyday lives, and they have a hard time visualizing its concrete consequences.
One section of the website features fictional cases based on real-life situations in three different countries: France, the Netherlands, and the Maldives.
The consequences of rising sea levels are fairly similar across all regions of the world (flooding, erosion, and salinization of soil and groundwater), but each country faces unique challenges and chooses to adapt to them in different ways.
Scientists distinguish several types of adaptation measures to sea-level rise:
-
maintain the existing coastline by protecting it or even reclaiming land from the sea,
-
adapt infrastructure, for example by building houses on stilts that are more flood-resistant;
-
support natural processes through nature-based solutions
-
or by relocating infrastructure so that the coastline recedes.

The three case studies selected follow the same format: an overview of the issues at stake (infrastructure, housing, economic activities, etc.), the selection of sea-level rise scenarios—short-, medium-, or long-term, and ranging from more to less pessimistic—and, finally, the adaptation solutions that are being considered or have already been implemented.
In the Netherlands, for example, the stakes are very high: a quarter of the country is already below sea level, and the tradition of fighting the sea goes back a long way. The decision has therefore been made to protect coastal areas with heavy infrastructure, such as estuary barriers. These structures include locks, bridges, dikes, and roads.

In the Maldives, the survival of this island nation is threatened by rising sea levels. Numerous solutions are being developed: protection through seawalls, raising buildings, constructing new, higher islands, and even building floating homes.
In France, in certain regions, the challenges remain relatively limited, which makes it possible to open up areas along the coast by relocating infrastructure. For example, the town of Quiberville-sur-Mer (Seine-Maritime) is relocating its campground to protect it from flooding.
These three examples illustrate the diversity of situations, as well as the need to fully understand the phenomenon of sea-level rise and to choose the scenario that best fits one’s situation in order to determine adaptation measures.
Understanding to Take Better Action
Given that sea-level rise is a global phenomenon with multiple causes and consequences that vary by region, understanding it cannot be limited to a single curve or a few figures. It requires analyzing complex data, developing scenarios that account for uncertainty, and, above all, making this knowledge accessible to those who will need to adapt to it.
The Sea Level Projection Tool embodies this approach to data translation, by combining scientific rigor, accessible storytelling, interactivity, and a regional focus. It is aimed at curious citizens as well as teachers, policymakers, and younger generations, offering them the tools to better understand the choices available to us. Because now more than ever, understanding change is the first step toward preparing for it.
The authors would like to thank Aimée Slangen, the BRGM IT team, and Clémence Foucher.