New calculations of worldwide glacial flows and volumes
Research
On February 8, 2022
Many mountain populations—in the Andes or Himalayas, for example—rely on glaciers for their water. Yet changes in glacial water reserves, like predictions of sea level rise, greatly depend on glacier volume and thickness, both of which have been poorly evaluated—until now. By analysing over 800,000 pairs of satellite images, researchers from the CNRS, Université Grenoble Alpes (France),[1] and Dartmouth College (USA) have established the first global map of flow velocities for 98% (>200,000) of the world’s glaciers.
As glacial flow is a function of glacial mass, knowing the former allows one to estimate ice thickness and spatial distribution, which in turn determine the total volume of water that glaciers hold and their future contribution to sea level rise. The researchers’ findings suggest glacial water reserves in the Himalayan watersheds of the Indus and Chenab are a third greater than estimated by previous studies, before the new satellite data were available. In contrast, the volume of water held in tropical Andean glaciers, which sustains over 4 million people, may be up to 23% smaller than once thought. The present study, published in Nature Geoscience (February 7th 2022), is based on Sentinel (ESA) and Landsat (NASA) satellite imagery that was analysed on Université Grenoble Alpes servers (>106 h of computer processing time). It had support from the French space agency (CNES).
[1] Working at the Institute of Environmental Geosciences (CNRS/Université Grenoble Alpes/IRD/Grenoble INP).

Watch Romain Millan explain this study in 1 min.
The data are accessible through the CES Glaciers - THEIA and can be visualized and downloaded through the THEIA interface and the Sedoo data portal for regional scale downloading.
The original version of this article was published on the CNRS website.
[1] Working at the Institute of Environmental Geosciences (CNRS/Université Grenoble Alpes/IRD/Grenoble INP).
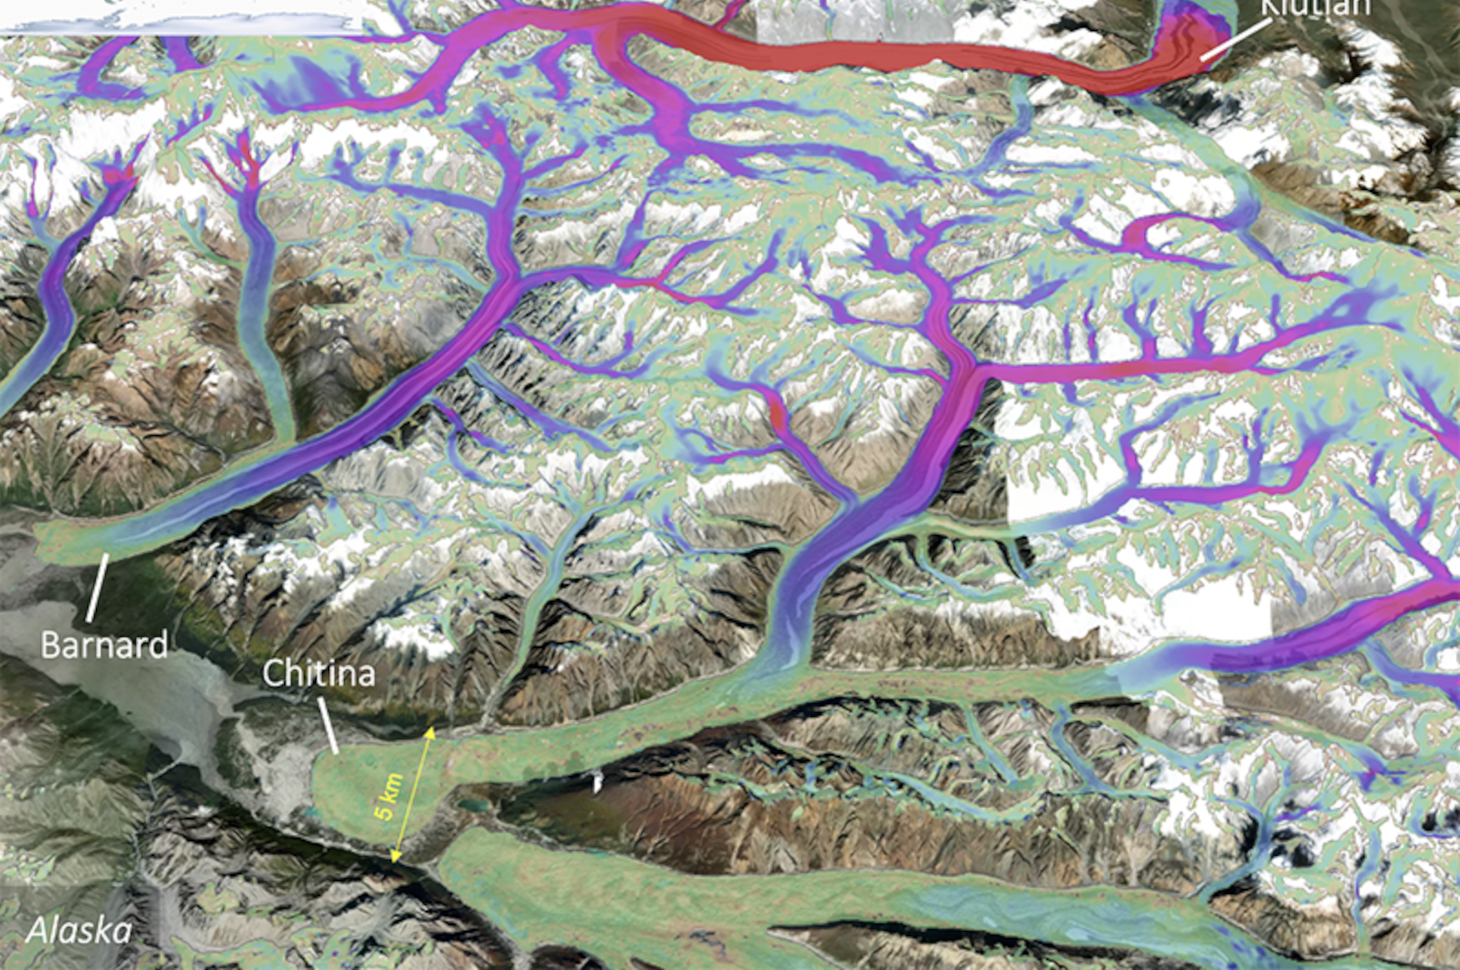
Ice flow velocities for and Alaskan (top) and Andean (bottom) glaciers.
Link for detailed visualization
© Romain Millan, Jean-Baptiste Barré / CNRS / IGE – Map data : Mapbox / OpenStreetMap / Maxar

Videos showing ice flow velocities and thickness for Barpu and Chogo glaciers in the Karakoram range, Himalayas.
© Romain Millan, Jean-Baptiste Barré / CNRS / IGE - Map data: Google / Maxar Technologies / Landsat / Copernicus / CNES - Airbus
Link for detailed visualization
© Romain Millan, Jean-Baptiste Barré / CNRS / IGE – Map data : Mapbox / OpenStreetMap / Maxar
Videos showing ice flow velocities and thickness for Barpu and Chogo glaciers in the Karakoram range, Himalayas.
© Romain Millan, Jean-Baptiste Barré / CNRS / IGE - Map data: Google / Maxar Technologies / Landsat / Copernicus / CNES - Airbus
Watch Romain Millan explain this study in 1 min.
(French with English subtitles)
The data are accessible through the CES Glaciers - THEIA and can be visualized and downloaded through the THEIA interface and the Sedoo data portal for regional scale downloading.
The original version of this article was published on the CNRS website.
Published on February 8, 2022
Updated on February 8, 2022
Updated on February 8, 2022
Contacts
CNRS Researcher
Romain Millan
romain.millan@univ-grenoble-alpes.fr
CNRS Press Officer
Véronique Etienne
veronique.etienne@cnrs.fr
Romain Millan
romain.millan@univ-grenoble-alpes.fr
CNRS Press Officer
Véronique Etienne
veronique.etienne@cnrs.fr
Bibliography
Ice flow and thickness of the world’s glaciers, Romain Millan, Jérémie Mouginot, Antoine Rabatel, Mathieu Morlighem. Nature Geoscience, 7 February 2022. DOI: 10.1038/s41561-021-00885-z