

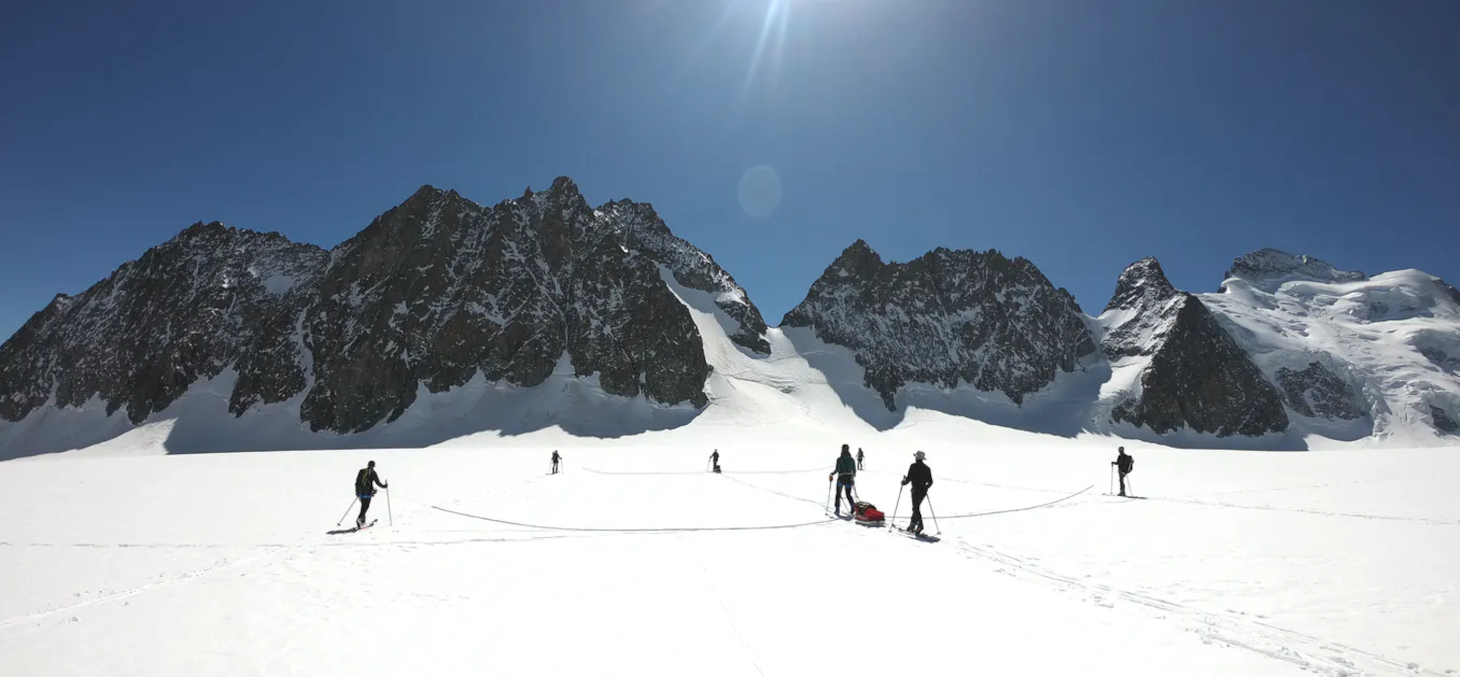
Despite their small size (727,000 km²) compared to the combined size of the two major ice sheets—Antarctica (14 million km²) and Greenland (1.7 million km²)—the melting of mountain glaciers has accounted for 30% of sea-level rise since the 1960s.
Beyond this global impact, the role of glaciers and their changes is crucial at the local level; thus, their future is a source of growing concern for mountain regions and their foothills.
Despite the fundamental role played by glaciers, we have only a very limited understanding of the volumes of ice stored in them. This is due in large part to the fact that glaciers are found at all latitudes, often in regions that are difficult to access. Conducting fieldwork directly in these areas is therefore very complex. As a result, ice thickness measurements currently exist for barely more than1% of the Earth’s glaciers (excluding the Greenland and Antarctic ice sheets).
Because of this lack of observations, scientists have developed indirect methods to estimate the amount of ice on Earth. These methods were initially based on the area of glaciers, which can be easily mapped using aerial photographs or satellite images.
Starting in the 2000s, methods based on the slope of the glacier’s surface emerged as digital models of the Earth’s surface became available on a global scale.
Beyond slope, the speed at which a glacier flows is an even more relevant factor for estimating the distribution of ice thickness. Indeed, glaciers flow under the force of their own weight; they are often likened to a highly viscous fluid, such as honey. Consequently, mapping the speed at which the glacier flows is essential for better estimating the distribution of ice thickness and, therefore, the volume of the glaciers.
However, field observations of these flow speeds are, once again, very limited, but the vast amount of satellite imagery has opened up tremendous possibilities for measuring the flow of all of Earth’s glaciers.
To quantify the flow velocity of all the world’s glaciers, researchers from the Institute of Environmental Geosciences in Grenoble and Dartmouth College (USA) used more than 800,000 pairs of satellite images. These images were acquired between 2017 and 2018 by NASA’s Landsat-8 satellites and the European Space Agency’s (ESA) Sentinel-1 and Sentinel-2 satellites. This new generation of satellites represents a revolution in glacier observation, with images of all land areas acquired systematically at regular intervals (ranging from 5 to 16 days). For example, the Sentinel-2A and 2B satellites capture an image of every point on the Earth’s surface every 5 days, with the ability to resolve objects as small as a few dozen meters. As a result, the movement of a glacier is clearly visible in these images when comparing two consecutive images.
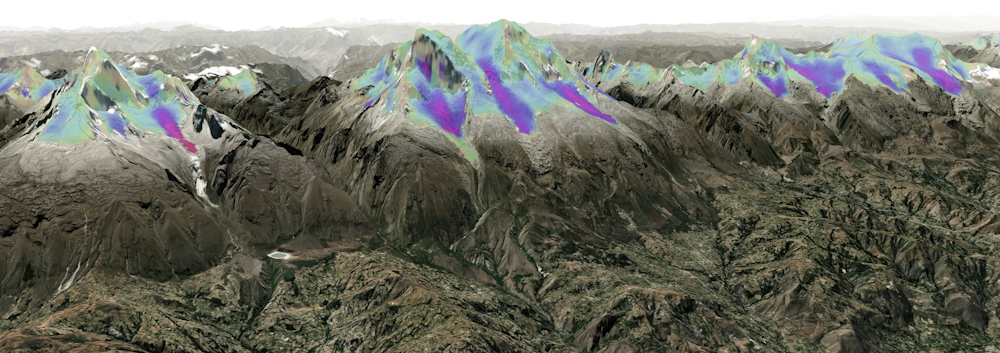
It took us several million hours of computation on the servers at the University of Grenoble Alpes to compile a unique atlas of the flow of more than 200,000 glaciers around the Earth.
One of the main contributions of this atlas is its coverage of a very wide variety of glaciers, ranging from small Andean glaciers just a few kilometers long to the ice caps of the Canadian Arctic and the ice fields of Patagonia, which extend over areas of several thousand square kilometers. These maps thus provide a better understanding of how glaciers flow.
They illustrate the wide variety of behaviors, with some glaciers moving at a rate of a few dozen meters per year (such as certain glaciers in the Alps), and others whose flow speeds reach several kilometers in a single year (for example, certain glaciers in Patagonia). This unique database allows researchers to more accurately refine the representation of glaciers in models, and thus to better estimate their future evolution.
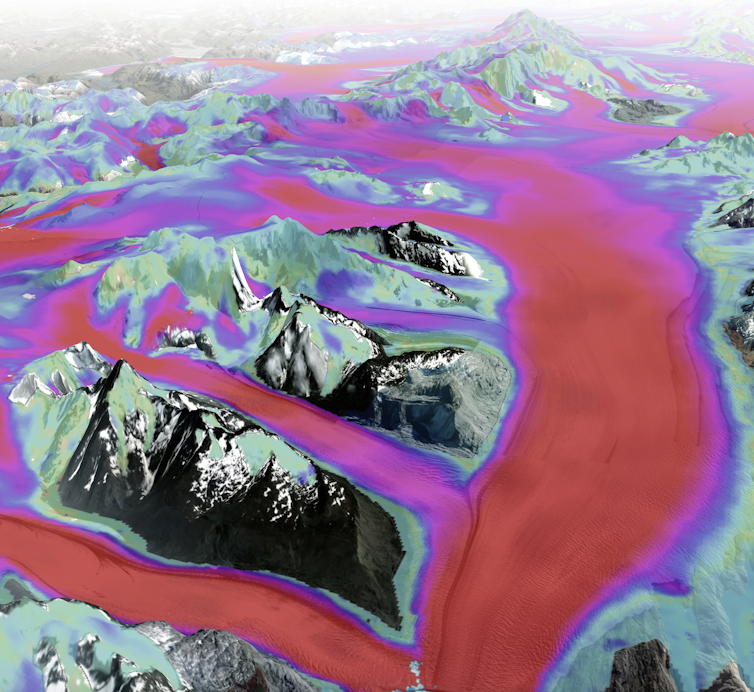
Furthermore, it was this comprehensive atlas of glacial flow velocities that enabled our team to re-estimate the distribution of ice thickness and, consequently, the volume of the glaciers. By combining information on the surface flow velocity of glaciers with that of the surface slope in a numerical model that simulates how ice slides and deforms, we were able to propose a new representation of glacier geometry.
In many regions, the findings of this study provide estimates that differ significantly from previous ones, with major implications for the availability of drinking water, as well as, for example, for agriculture and hydroelectric power generation. For example, in the Indus and Chenab basins, located in the Himalayas, the water reserves contained in the glaciers are estimated to be 30% greater than in previous studies. Conversely, in the tropical Andes of South America, the new estimates are more alarming, with glacial water reserves nearly a quarter lower, thereby increasing pressure on water resources in these regions.
Beyond providing a new assessment of glacier volume, this study makes it possible to redefine the three-dimensional geometry of glaciers with greater precision and in accordance with the mechanics of ice flow. This is crucial for better simulating the future evolution of glaciers and, in particular, for identifying which areas will see glaciers disappear and which will likely persist—at least until the end of the century—albeit in significantly reduced sizes.
This study represents a major improvement in the quantification of ice thickness distribution. However, estimates of glacier volume remain subject to significant uncertainties, particularly in regions of the world where populations are heavily dependent on glaciers. To minimize these uncertainties and improve results in these regions, it is essential to have some field observations available in order to better constrain the calibration of thickness modeling. This calibration step is all the more important given that glaciers are diverse systems subject to a wide range of environmental conditions. Consequently, using behavioral laws in models that are based on observations from only a few glaciers is necessarily a source of uncertainty.
This article is republished from The Conversation under a Creative Commons license. Readthe original article.